Trends in the County Budget
Posted by PBCTAB on September 3, 2018 · Leave a Comment
The first public hearing on the FY2019 county budget is scheduled for Tuesday, September 4 at 6PM.
As laid out in June, the county intends to keep the millage flat at 4.7815. With the updated valuations at around $188B, up 6% over last year’s $176.8B, that will give them another 6.2% to allocate to new spending and to reserves.
301 N. Olive Street, 6th floor.
Links:
The increased tax collections for 2019 will go primarily to salary and benefit increases (another 3% COLA across the board – for the fifth year in a row), a $31M increase for the Sheriff, 81 new positions being created, and the addition of about $20M to reserves. The reserve funding will bring the total unrestricted reserves up to about 9.2% of the gross General Fund budget.
As this is the seventh year of flat millage, it should be noted that the county-wide taxes collected in those years (FY2012-2019) increased from $595M to $898M, a 51% increase due solely to increased property valuations. That is an average of 7% per year.
The county implies in their budget package that the increases have been less than TABOR (population growth and inflation), but is that really true? It all depends on the base year you pick.
We at TAB have been following the trends in the county budget using data starting in 2003 – a 16 year stretch to the current 2019 Fiscal year.
As the following chart 1 indicates, county tax collections significantly declined in 2008 and 2009, and did not really start to recover until 2013. This was due to a number of factors – real estate prices collapsed leading to the financial collapse of 2008, but a major effect on local governments was the legislative changes that made “save our homes” portable, an increase in the homestead exemption and the addition of more classes of property subject to caps.
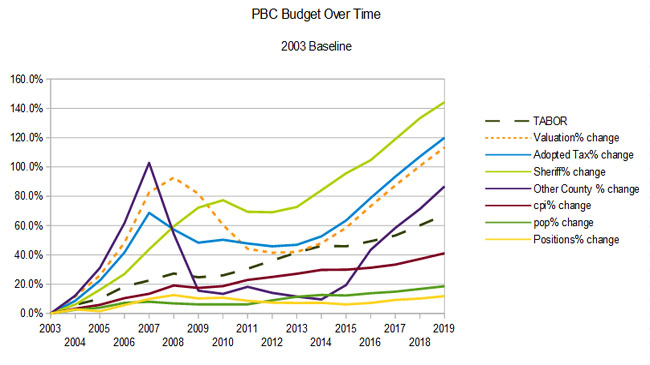
Chart 1 – 2003 Base
Following the peak of 2007 (prior to which county taxes were expanding at an unsustainable rate), county-wide ad-valorem taxes, excluding the Sheriff, fell 43% in two years – a decline of $150M. This was accompanied by a drastic reduction in capital spending, and a gradual decline in staffing. As of today, we still have not exceeded the 2007 peak of non-Sheriff taxation. (The total ad-valorem tax level passed the peak last year). Referring to chart 2, you will see that until recently, although the Sheriff has always exceeded TABOR by a large margin, other county spending did not.
So, in order to make the current level of taxation not look so bad, the county uses the peak year 2007 as its baseline for comparisons. In the second chart below, you will see that using a 2007 base keeps total ad-valorem spending under the TABOR line, even when including the Sheriff’s budget, which now accounts for 64% of the total, down from a peak of about 70% in 2014.
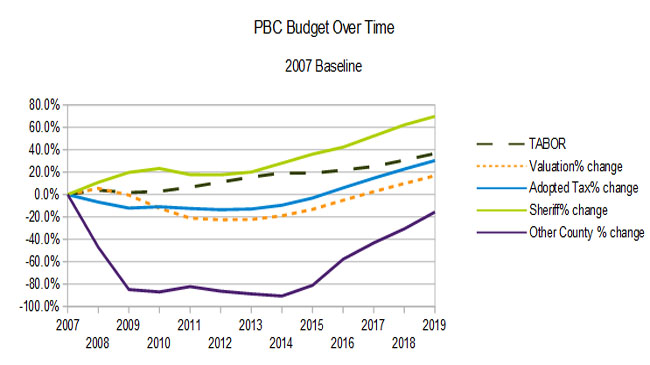
Chart 2 – 2007 Base
On a per-capita basis (inflation adjusted), the county taxes have increased from $475 to $625 since 2003 (in 2018 dollars). Since 2007 they have actually fallen from $655 to $625. (See chart 3).
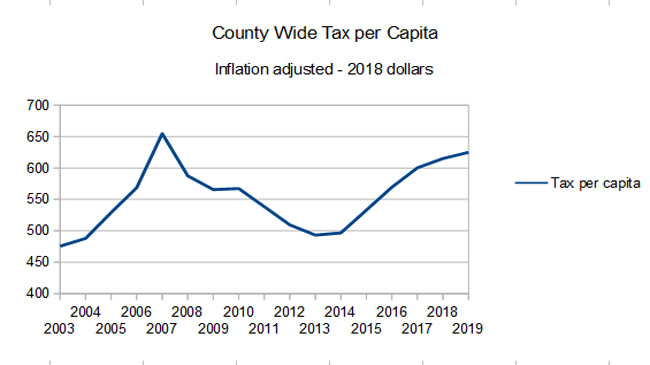
Chart 3 – Per Capita Taxes
Chart 4 shows the millage and ad-valorem taxes over time. We also show the effect of the revenue from the sales tax surcharge passed by referendum. The 2019 surcharge will amount to about $71M.
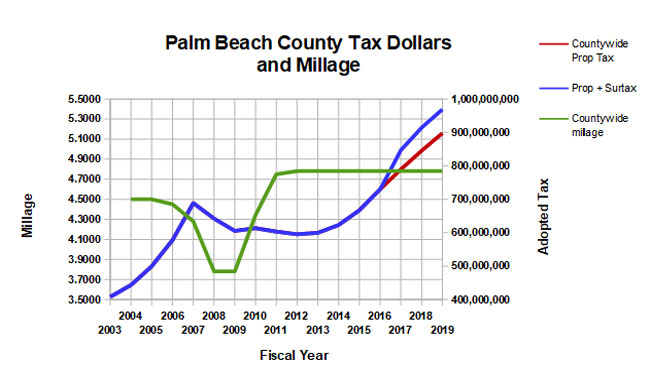
Chart 4 – Millage and Taxation