County Proposes No Change to Millage, $23M Tax Increase
The July budget line item is included in the next scheduled BCC Meeting on Tuesday, July 16, which starts at 9:30am. It is item 5G-1 on the agenda and will likely be the last item of the morning session.
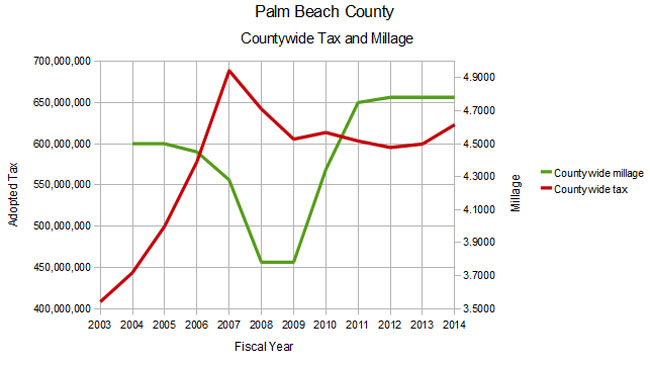
The first county budget proposal for fiscal year 2014, presented at the June 11 meeting, called for a millage increase to 4.8164 (up from the current 4.7815) and $25M in new ad valorem tax revenue – mostly to fund new spending proposed by the Sheriff.
While not definitive, the drift from the dais was that they would like to see flat millage (Abrams, Burdick, Valeche) and more spending on priorities like road repair and less of an increase to PBSO. Some commissioners, particularly Shelley Vana, didn’t want to be “penny wise and pound foolish” and thought that flat millage should “no longer be the holy grail”.
So we were pleasantly surprised to see that the July Budget Package is introduced under separate cover by Administrator Bob Weisman with
down to the current year 4.7815.
During the month interim, Mr. Weisman and staff were able to achieve this by:
- Seeing an additional $2.6M from increased property valuations
- Allocating an additional $2M from the proceeds of the $26M Mecca Farms sale into 2014
- Gaining $859,000 in concessions from the Sheriff – which is half of the remaining shortfall with flat millage.
He was also able to increase funding for some priorities, including:
- $1.6M for neighborhood road repaving
- $270K for the Palm Beach sand transfer plant
- $100K in additional funds for the Business Development Board
With the new assumptions, the flat millage proposal will generate a countywide tax of $623M, up $23M from the 2013 fiscal year, slightly less than the June proposal. As seen in the chart, this is a visible uptick from previous years, and is the highest tax collected since 2008, when the millage was at a low point of 3.7811.
Assuming that the valuation increase this year is a start of a trend, flat millage will no longer be acceptable going forward and we will be expecting substantial reductions. That said, the current proposal of flat millage appears to be a genuine attempt to satisfy the pent up spending demand, particularly for salary increases for county staff while not overly gouging the taxpayer. Historically, overall county spending is approaching a “TABOR” (population and inflation) projection from a 2003 baseline. (See Determining County Budget Growth – Why the Baseline Year Matters )
Assuming the BCC accepts the flat millage proposal, we do not expect to be calling for any taxpayer actions during this budget cycle.
Determining County Budget Growth – Why the Baseline Year Matters
For the last few years, whenever the county budget has been presented, growth has been charted based on the year 2003. Numerical comparisons were made to 2007 though, and this year even the charts are based on 2007. Does this make a difference? What do the two baseline years tell us about the growth in spending and how the county staff wants you to look at it?
As you may remember, the middle of the last decade saw a real estate “bubble”, where average properties in the county became greatly inflated – sometimes doubling in only a few years. The year 2007 represented a leveling off of the valuation increases, with values 83% higher than they were in 2003. Valuations climbed a little more in 2008 (to 93% of 2003), and then began a rapid decline to the bottom in 2012 at 43% of 2003. Today’s levels are about 48% of the 2003 values.
Since county property tax follows property valuations, as you would expect, the county’s revenue and spending exploded during this runup period. In the four years from 2003 to 2007, the overall county-wide “ad valorem equivalent” (a measure of spending) rose 42%, led by Fire/Rescue which saw its spending almost double (90% increase). By adopting 2007 as their “base year”, the county would like you to overlook this rapid growth prior to that, and imply that the relatively flat spending since 2007 is “normal”.
Consider the following chart, based on 2003:
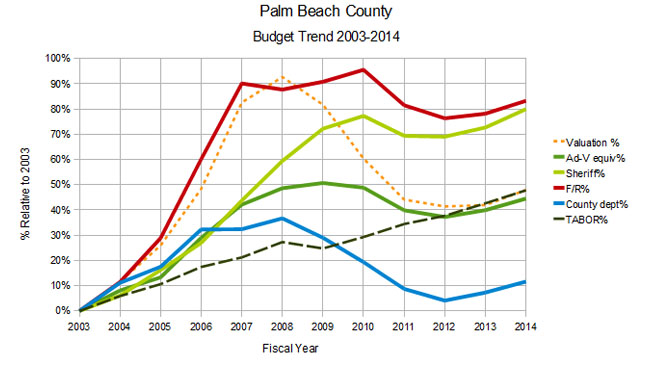 Chart 1 – 2003 Baseline
The dashed orange line shows the real estate “bubble”. Note that the Fire / Rescue spending climbed the “bubble”, but then stayed at the higner level as the bubble burst. The Sheriff’s budget did a similar thing, although their spending lagged a little. Both are up over 80% since 2003. Spending on the “rest of the county” (blue line) – including engineering, Palm Tran, community services, information systems, parks and recreation, and the other constitutional officers was the big loser, as the “total ad-valorem equivalent” (the dark green line) – which includes all county functions stayed as high as the taxpayers would accept, up 45% and ending at about where the valuations did. The dashed green line represents “TABOR”1, or the increase in spending that would be justified by changing population and inflation. Interestingly, the “total ad-valorem equivalent” ends about on the TABOR line, even though spending greatly exceeded it in the middle years.
Now consider the next chart which uses 2007 as the baseline year:
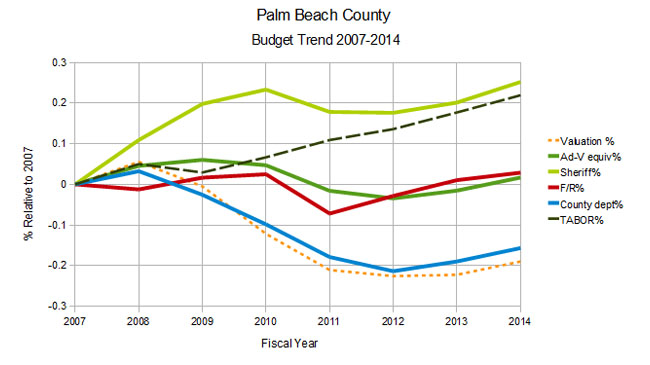 Chart 2 – 2007 Baseline
Using the “bubble” spending levels as a reference, it appears that “total ad-valorem equivalent” is flat – exceeding the 2007 level by only 2%, and well below “TABOR”, and the county department spending has actually declined by 16%. Even the grossly inflated PBSO budget looks like it is converging on the “TABOR” line.
If you were the county administrator and you wanted to make the best case for fiscal responsibility, which chart would you use?
Baselines do matter.
There are many external factors that should determine the “appropriate” level of spending of tax dollars, such as the health of the overall economy, the declining average income in the county, the “artifacts” in the valuation numbers from foreclosure dynamics and demand for real estate by third party investors. From a strictly historical perspective however, most would agree that the spending growth in the years leading up to the bubble were wild and crazy. The great recession has brought some of the spending back down to earth as measured by inflation and population growth as shown on chart 1, with the notable exceptions of PBSO and Fire/Rescue.
With a 2003 baseline, county spending today looks almost responsible, and the case can be made without changing the baseline to obscure the rapid growth of government leading to the bubble. We hope that county staff does not plan to rewrite history.
1. TABOR is an acronym for “Taxpayer Bill of Rights”, a legislative approach tried is some states to control spending growth by limiting it to the inflation rate and population growth.